ENPH353 - Autonomous Driving AI Detective
About the Project
ENPH 353 is a machine learning project course where students must code an agent that autonomously navigates an obstacle course while reading clues off signs around the track.
In this class we use Gazebo and the ROS framework. Our team coded everything in Python, using OpenCV for computer vision and Pytorch for machine learning. Our robot controller package is located here.
We chose to use imitation learning to drive as we thought it best aligned with the spirit of the course (and because line following is boring!). We we're the only team who managed to get imitation learning working, and we scored the best out of all the teams who tried machine learning for driving.
We also wrote a final report for this project which you can check out here.
Here's a video of our robot navigating the course! -->
I forgot to reset the clue reader in the vid which is why it ignored the first clue :P
Full Run Using Imitation Learning for Driving and CNN for clue board detection
Introduction
Overview
In this project, we developed code for an autonomous robot to compete in a simulated virtual environment.
The robot, acting as a detective, must navigate through the environment to identify and collect clues related to a fictional crime scenario while adhering to traffic laws. The robot also had to avoid obstacles, namely the pedestrian, the truck, and Baby Yoda.
The robot's performance was evaluated on three main criteria
- Its ability to quickly navigate the course.
- Its ability to stay on track and avoid obstacles.
- Its accuracy in reading messages off the clue boards stationed around the track.
A diagram of the track is shown on the right.
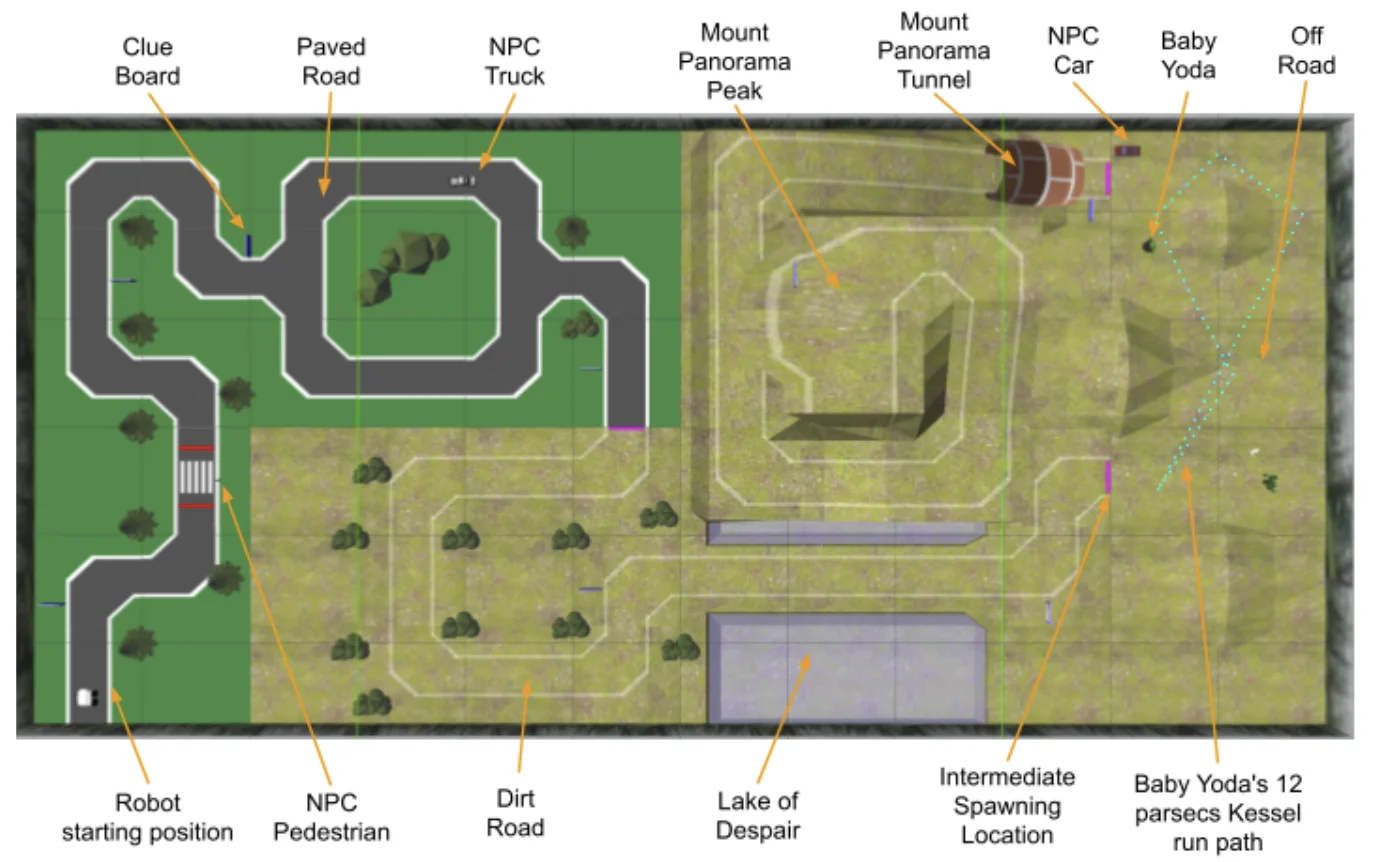
Diagram of the Competition Track
Scoring
The first six clues are worth 6 points and the last two are worth 8. This results in a maximum of 52 points from clues alone. There's also 5 bonus points you can get from reaching the tunnel area. This adds up to a total of 57 points.
Alongside points, there are many penalties that teams can acquire. In fact, some teams get negative points. The penalites are as follows:
- Penalty of -5 for colliding with the pedestrian/truck/baby Yoda.
- Penalty of -2 for going offroad.
- Penalty of -2 for respawning/teleporting.
Speaking of respawning/teleporting, teams are allowed to teleport/respawn at the pink lines. It is good to teleport if you're robot cannot consistently navigate a section of the course.
Fizz Score Tracker with Full Points
Package Overview
Topics
There are four main topics that our robot subscribes/publishes to.
- /B1/rrbot/camera1/image_raw: This topic contains camera footage from the front facing camera.
- /B1/rrbot/camera2/image_raw: This topic contains camera footage from the left facing camera.
- /score_tracker: This topic is where we send our clue guesses. It's related to the score tracking GUI.
- /B1/cmd_vel: This topic is responsible for controlling the robots movements.
All of the robot control logic is located in the same files as the GUI's. Perhaps it would have been better to seperate the robot logic from the GUIs, but we didn't think it was worth thinking about given the time constraints.
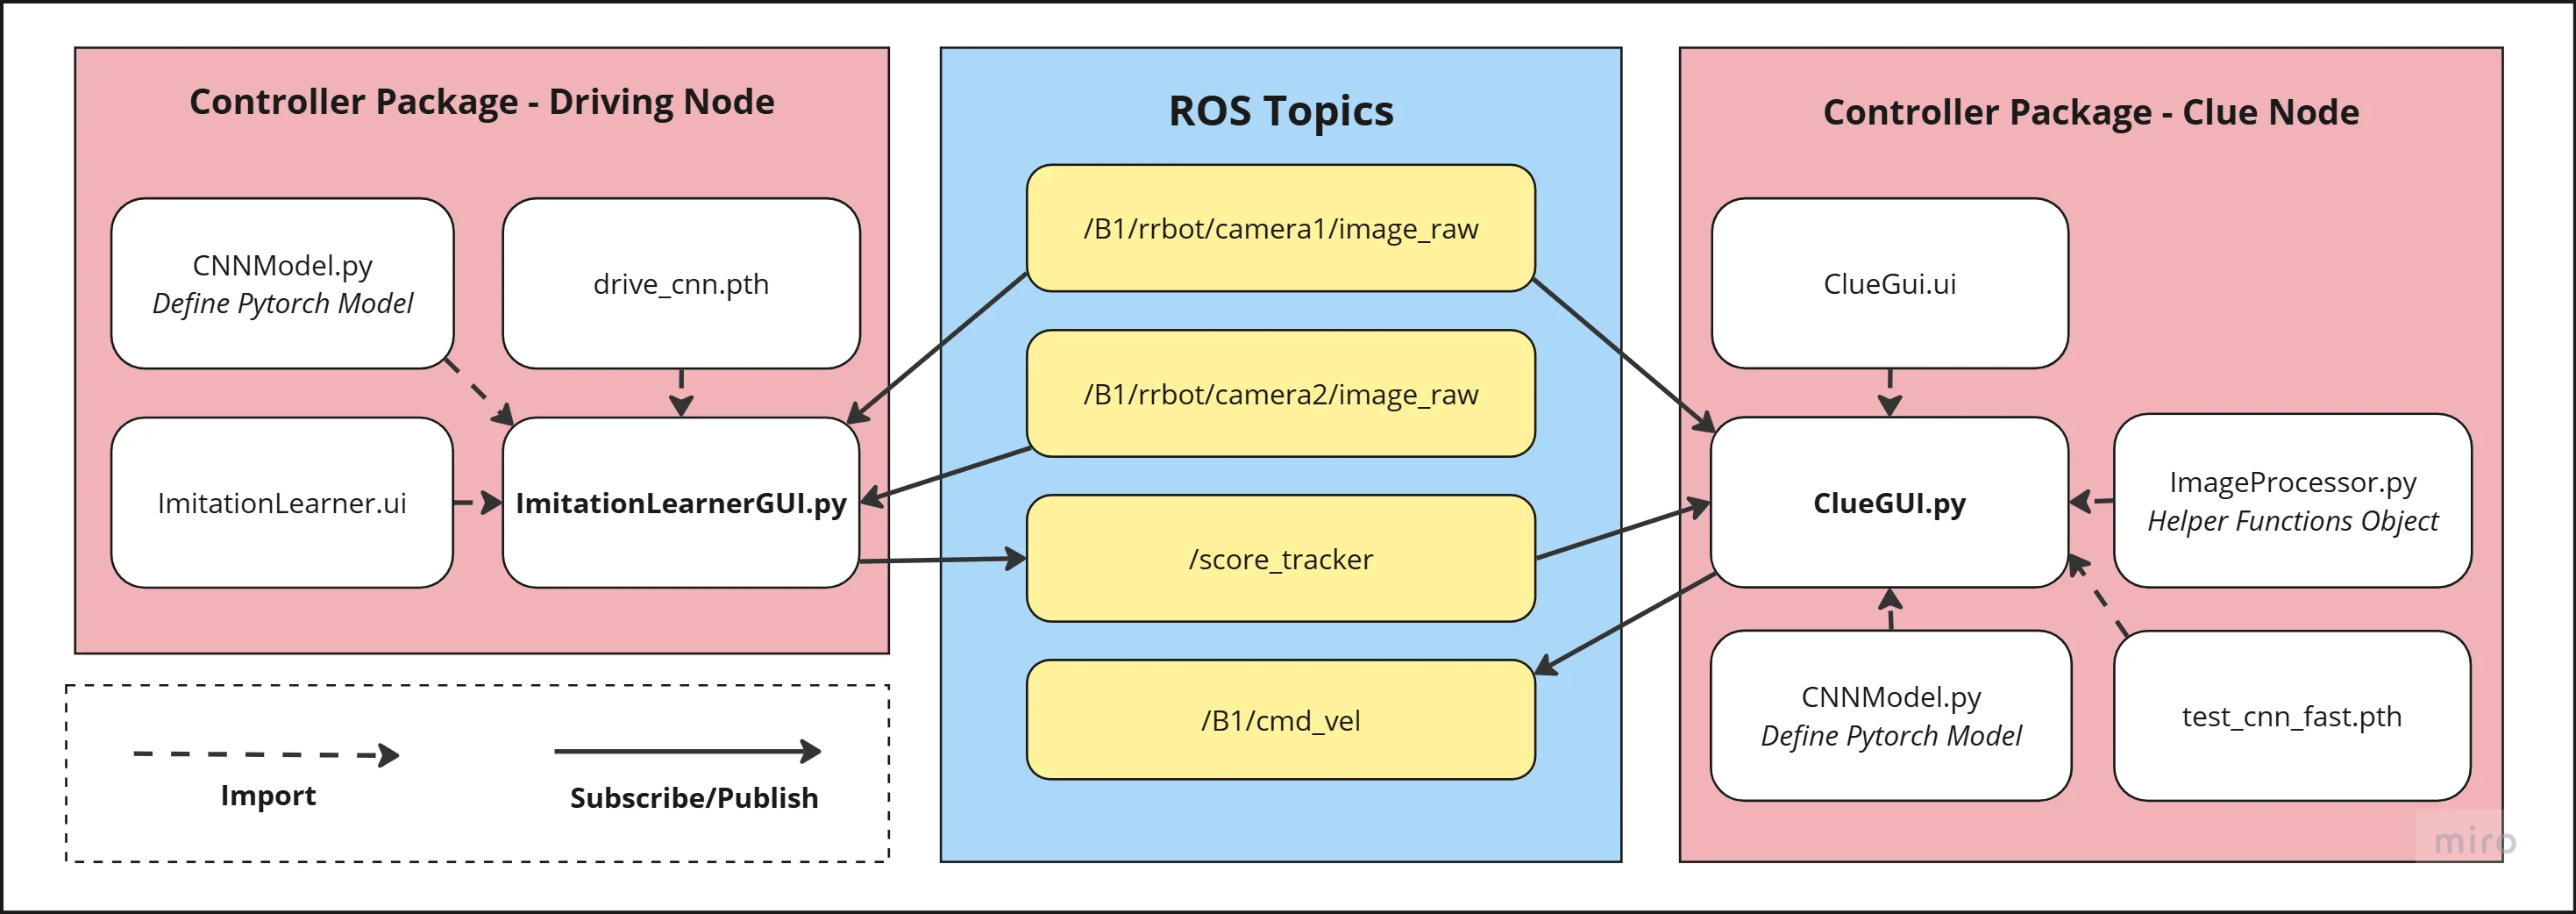
ROS Controller Package Overview
Clue Recognition
Goal
The goal here was to take a raw image, search it for a clue board, read the clue off the clue board and then publish our best guess. We needed an algorithm that was fast, reliable (and cool)!
Clue Board Detection - SIFT
First things first, we needed a way of extracting the clue board from the camera footage. We went through quite a few ideas before arriving at our final algorithm.
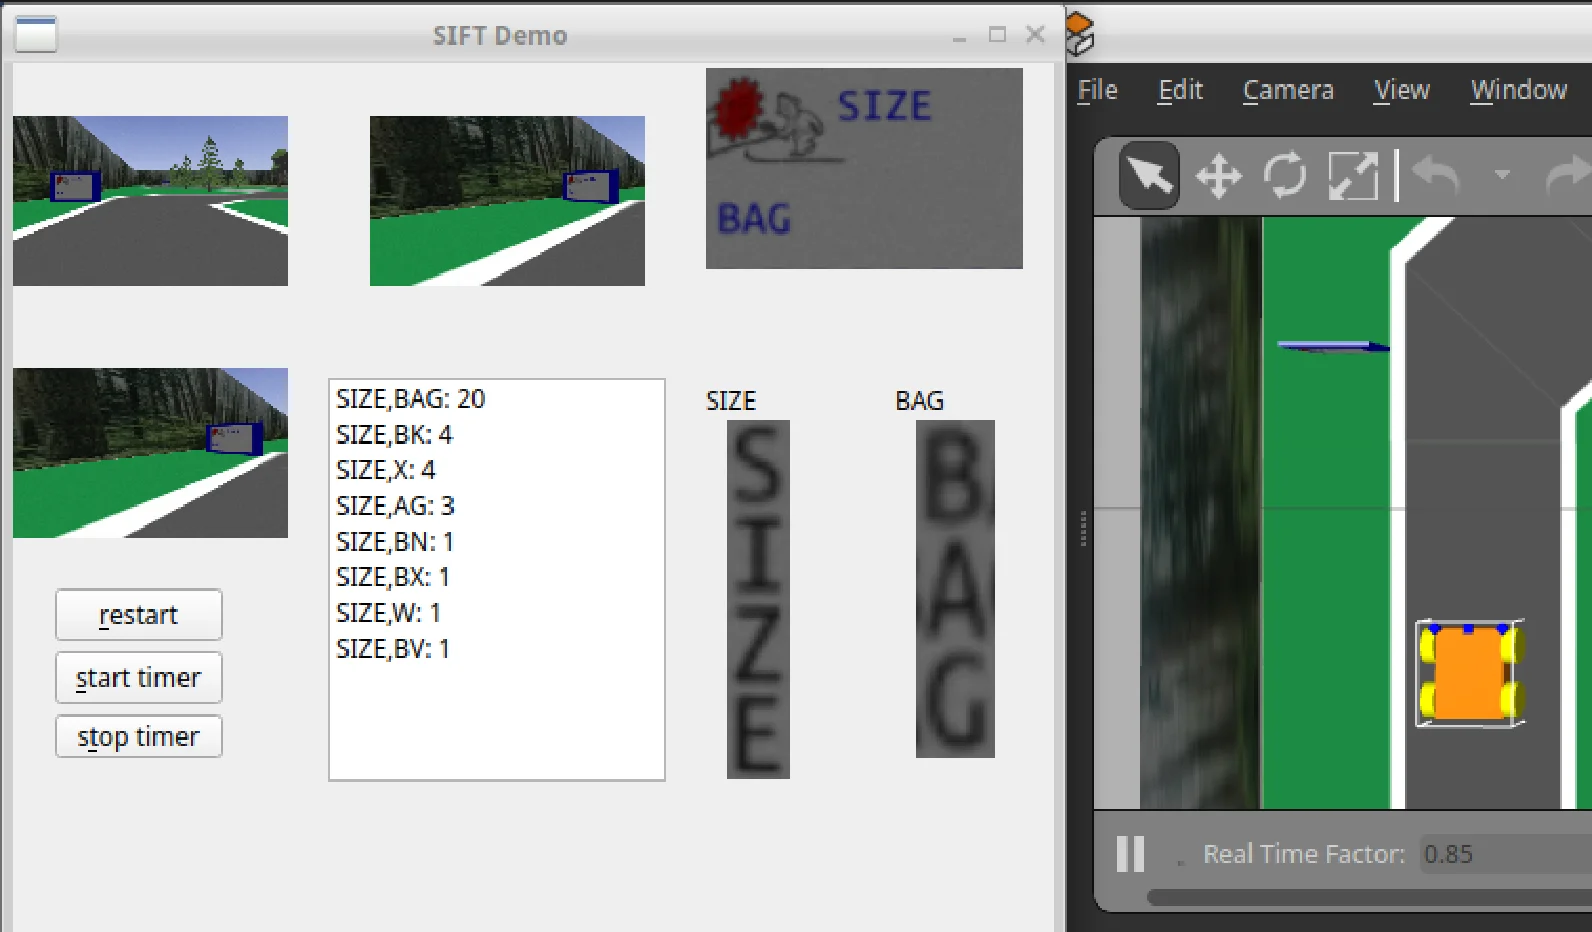
Our first idea was to use SIFT (Scale-Invariant Feature Transform). SIFT is a computer vision algorithm that detects keypoints in a template image by finding distinctive, scale- and rotation-invariant features, which it then located in a target image.
The clue boards always have a FIZZ logo in the top left. The idea was to use SIFT to locate the FIZZ emblem which would then allow us to get the homography and perform an inverse perspective transform.
We can see that this worked quite well on the right! Or at least it looks like it does. As it turns out, SIFT is incredibly computationally expensive and slow :(. It was highkey overkill here, but still really fun to try out.
Example of SIFT in Action
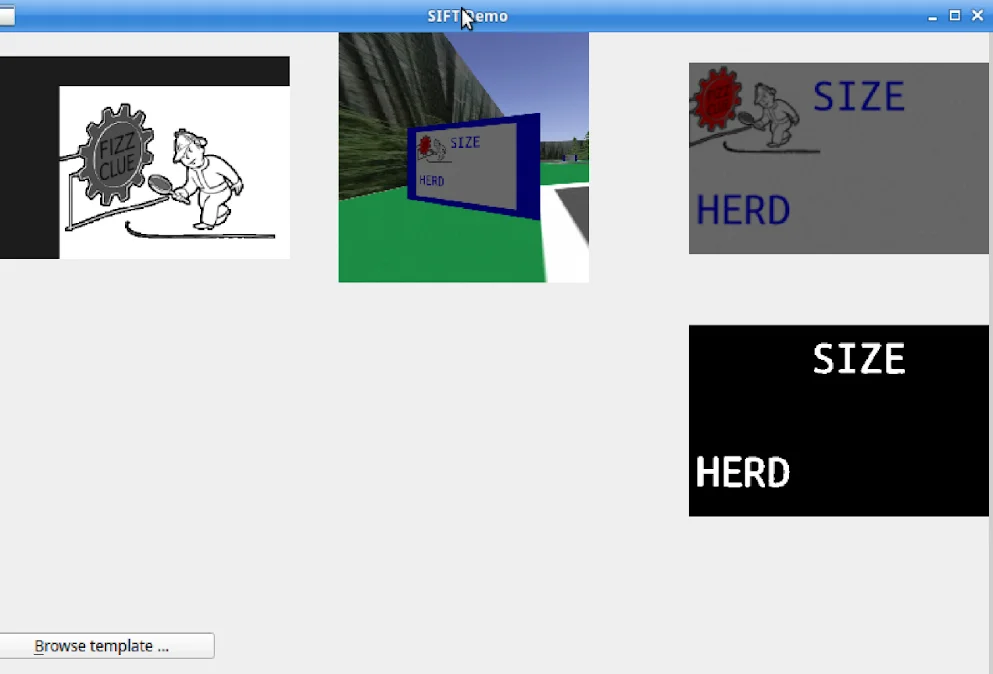
Clue Board Detection Using SIFT Algorithm
Clue Board Detection - HSV Mask
After realizing SIFT was too slow (and overkill) we went back to the drawing board. I decided to play around with HSV masks. In hindsight we probably should have started with this, I just didn't feel like it haha.
Our clue board detection algorithm first uses a gray HSV mask and the morphological closing operation to make out the largest gray contour on screen.
It then tries to find 4 corners and then uses that to perform an inverse perspective transform. The result is a nice clean head-on image of our clue board.
We originally tried using a blue HSV mask but encountered issues when the camera was super close to the clue board, namely parts of the blue clue board outline would get clipped and lead to weird inverse perpsective transforms.
I also want to note that before we do any kind of clue board detection, we use a blue mask to check the area of the largest blue contour. This was to check whether we were close enough to the clue board as images taken from far away would become quite fuzzy :(
The robot has bad eyesight just like me >_>
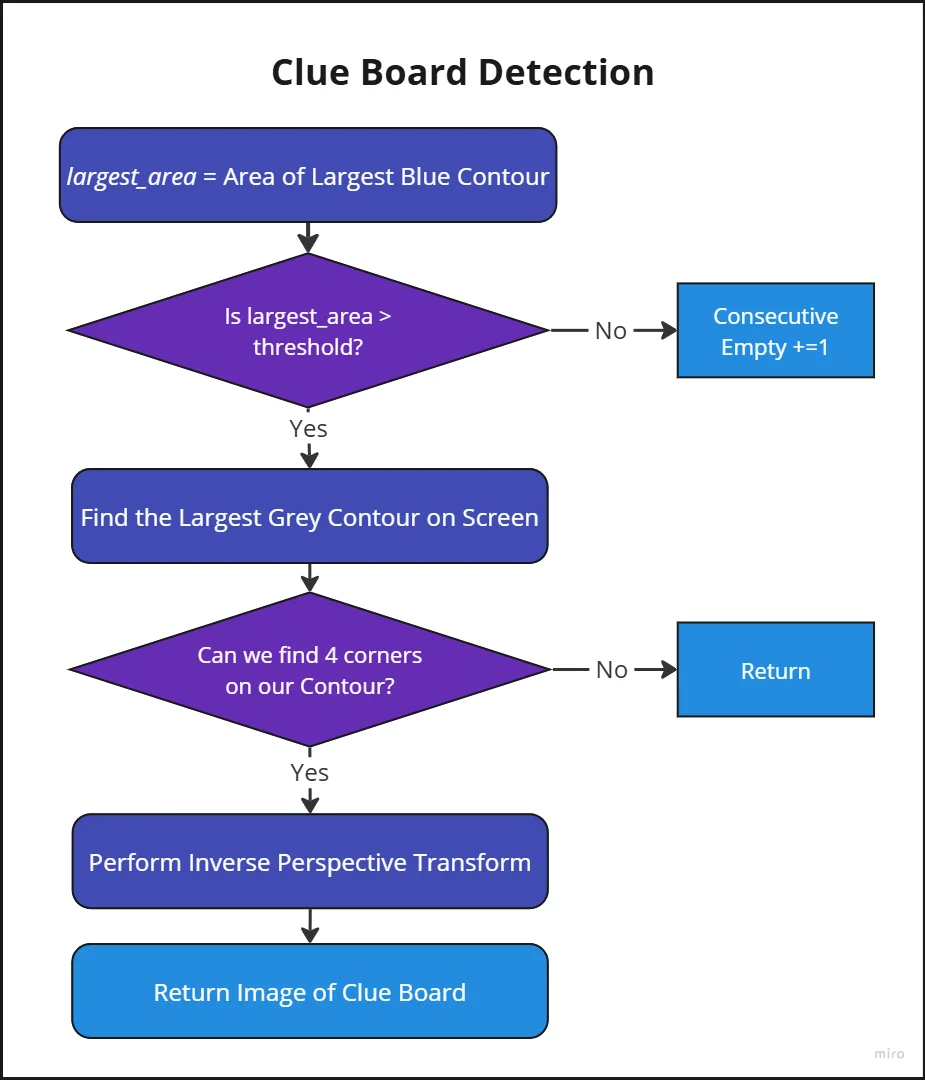
Clue Board Detection Block Diagram
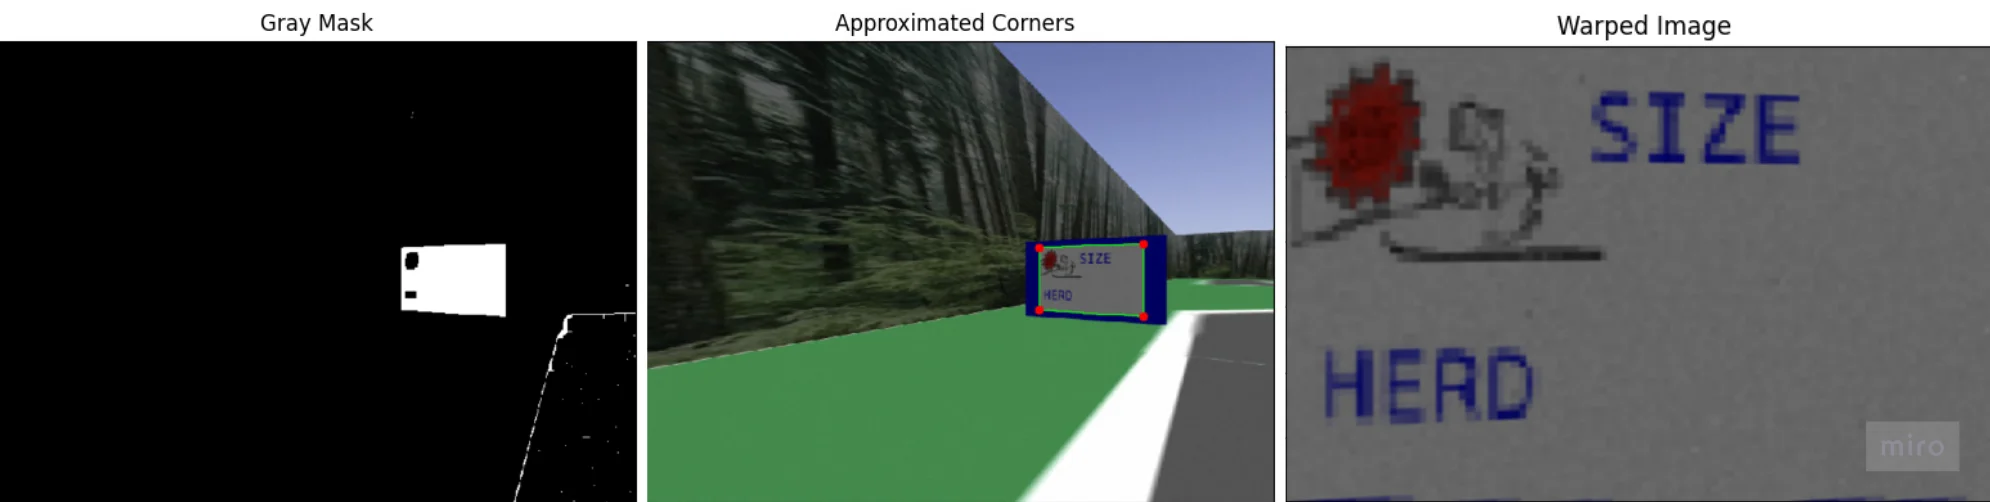
Grey Mask to Inverse Perspective Transform
Letter Segmentation
After we detect a clueboard and perform the inverse perspective transform we then try to extract the two types of text from the board:
- Context: Text on the top half of the board. Tells you the type of clue.
- Clue: Text on the bottom half of the board.
We do this by splitting the clue board into a top and bottom half. We then mask for the blue letters, we erode (horiziontally) to prevent the letters from merging into each other, we find contours, and then draw bounding boxes around them and cut them out.
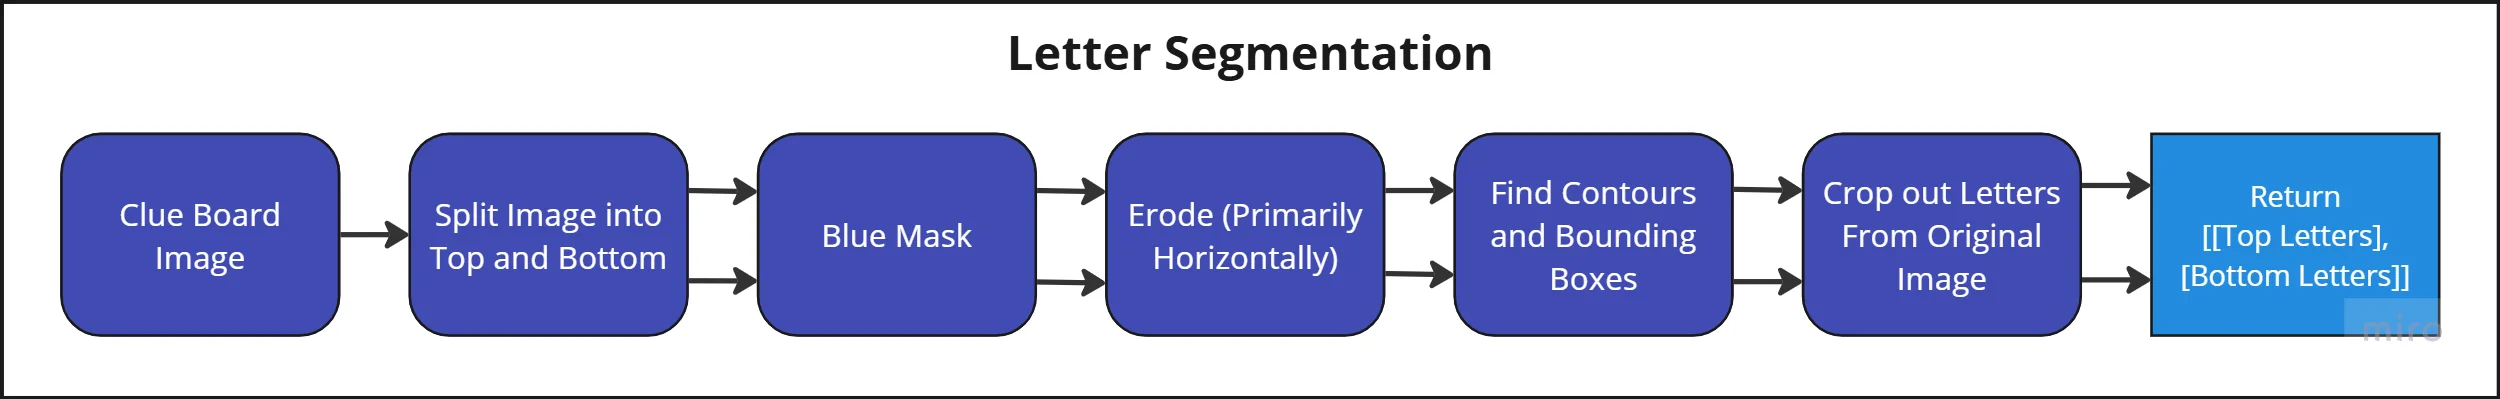
Letter Segmentation Block Diagram
Issue: At competition, we lost points because the text letters "OO" bleed into each other when read from afar and get read as one massive letter. We could have fixed this using a constant cropping technique (simple) or by checking to see if the aspect ratio made sense (letters should be more tall than wide, otherwise they should be cut)
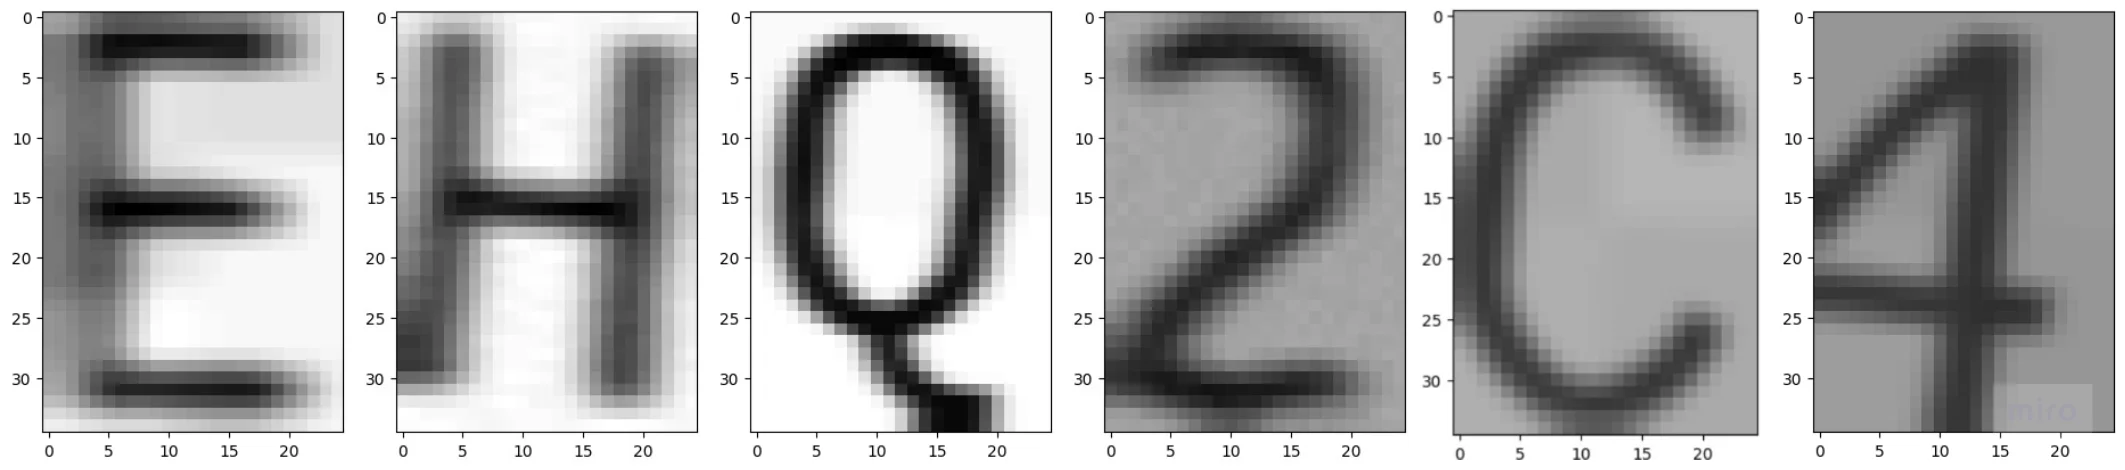
Anyway, this worked very well on clear images or letters that were skinny. Below is an image of the cropped letters.
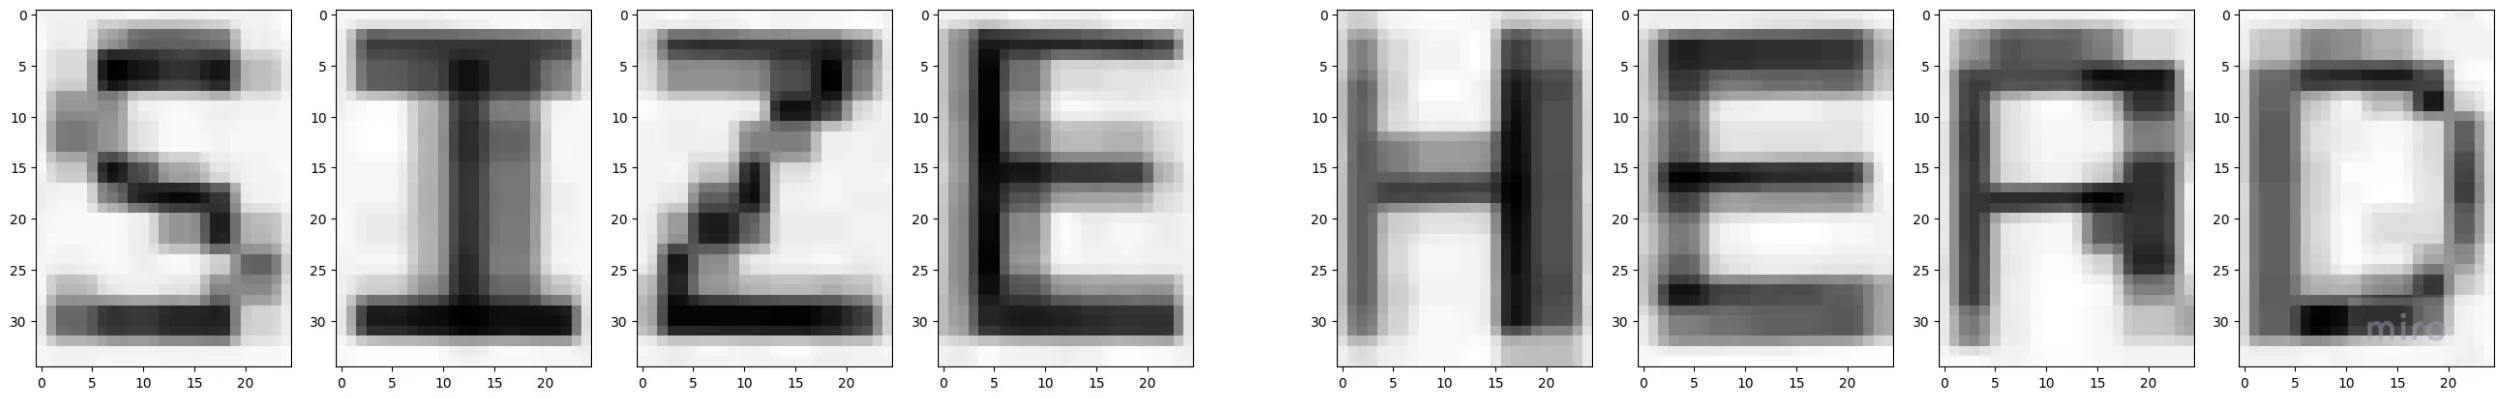
Letters Cropped From Distant Clue Board
CNN Model
Our clue readng CNN takes 25x35 greyscale images.
It contains three convolution layers with ReLU activation functions. Each convolution layer is followed by a pooling layer. The output is then fed to two fully connected layers.
The final layer contains 36 output neurons which correspond to the 26 possible letters + 10 possible digits.
Initial Mistake: I was a goofy goober and intially gave our first FC layer 4096 parameters. This meant that we originally had ~6.5 million parameters in our model :| The model was approx 25Mb in size ;w;. I fixed this by reducing the number of neurons to 200 which resulted in about 400k parameters and a ~2Mb model size.
There was likely room to improve the model more but we moved on in the interest of time.
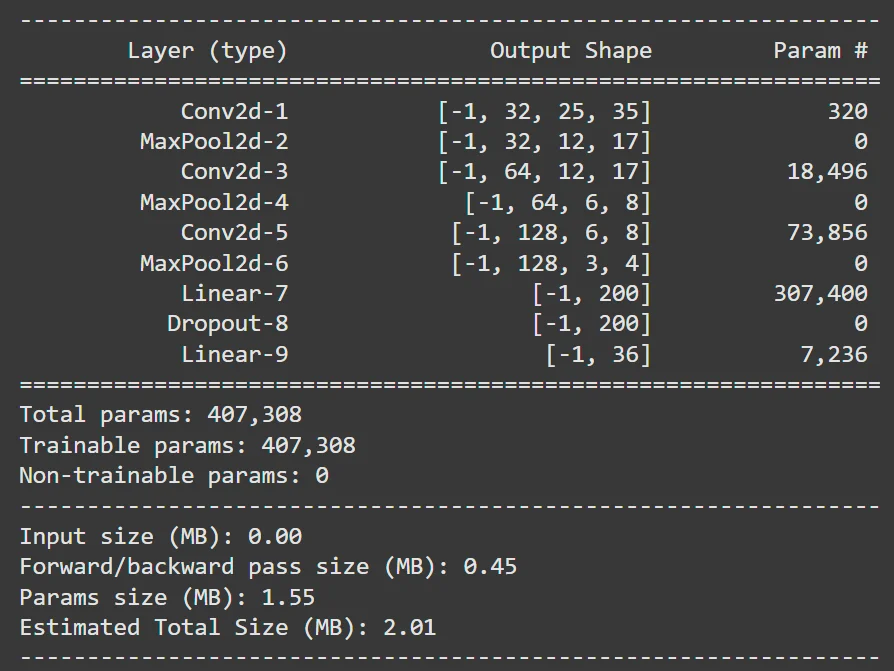
Autogenerated Summary of Clue CNN
Data Generation
We trained our model on artificially generated data. We generated 25x35 images of letters, and applied a variety of transformations on the data.
We changed lighting, wobblyness, rotation, position, noise and blurriness. Since the clue boards would usually be viewed from the left or right, we added extra examples of images blurred horizontally. We also added extra examples for 'B', '8', 'O' and 'Q' because it's hard to tell the difference.
Autogenerated Summary of Clue CNN
Training and Result
As this was a classification problem, we used Cross Entropy Loss as our criterion and Stochastic Gradient Descent as our optimizer.
Our learning rate was 0.001, our momentum was 0.9, and our weight decay was 0.0001. We typically trained for about 10 epochs at a time.
Our confusion matrix on the right shows that the model appears to be performing very well. We added extra examples of letters like "O", "P", "B", and "8" as the model originally often got those confused.
Our final validation accuracy was 99.80% :D
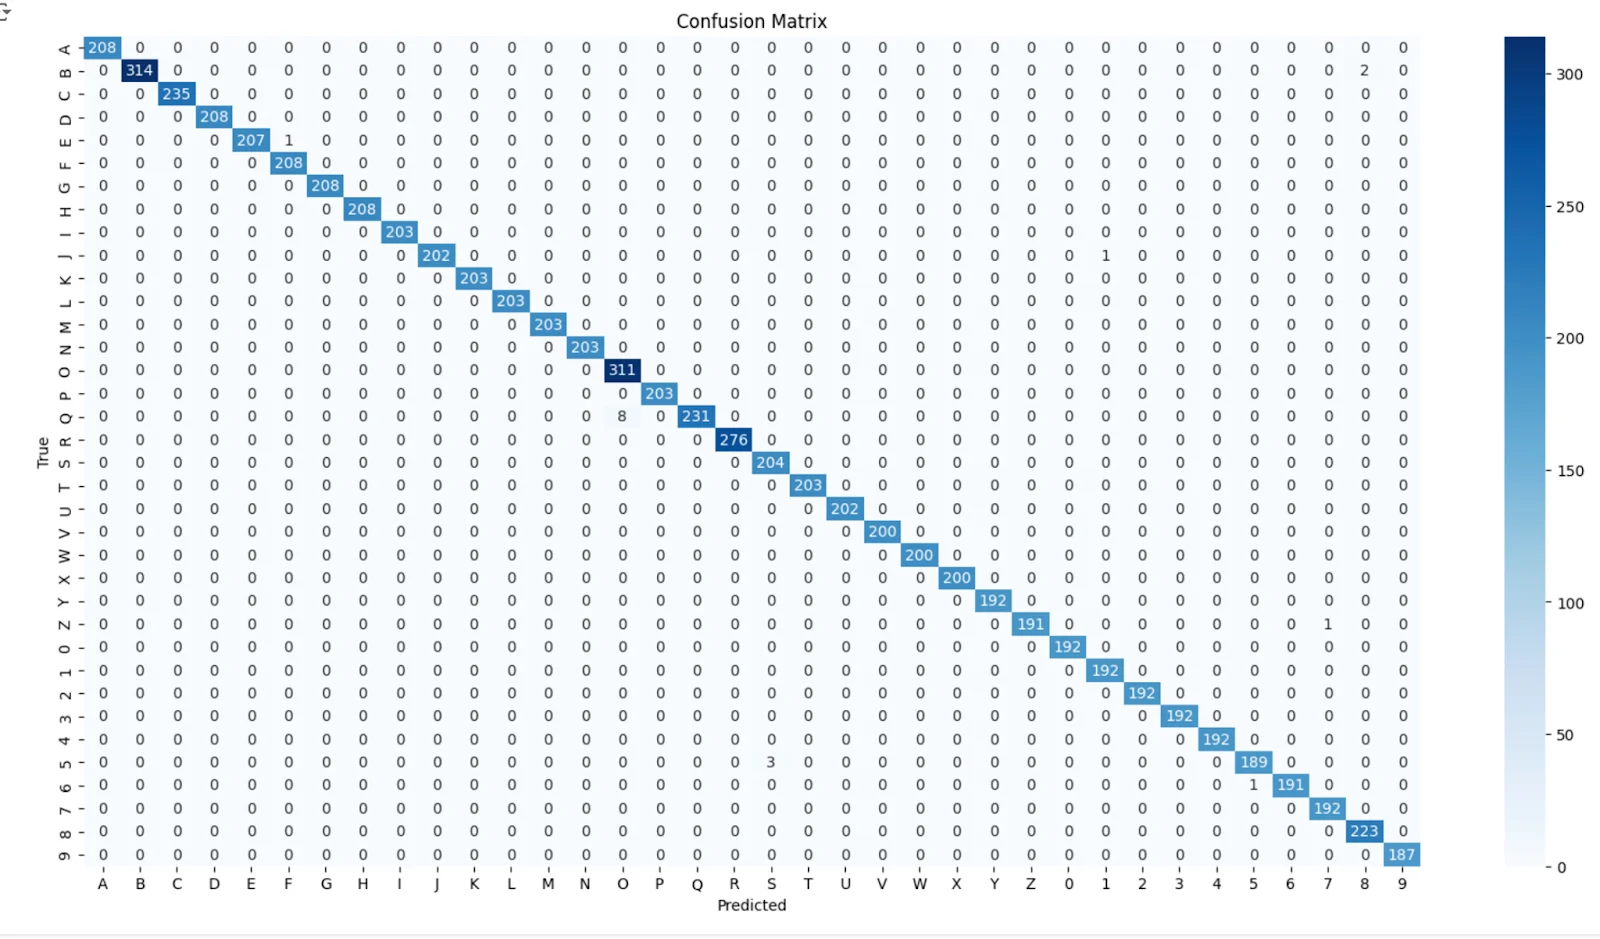
Confusion Matrix for Letter Classifier CNN Model
Integration
All of aforementioned image processing algorithms are called by the clue GUI. Here is the general workflow.
- The GUI first looks for a clueboard by searching for large grey rectangles.
- If found, an inverse perspective transform is performed and the clue board is split into a top and bottom half.
- The top and bottom half have their letters cut out and fed into a CNN which ultimately converts the letter segment images into a string
- The context and clue (top and bottom text) are then saved into a hashmap which records how many times that specific context/clue pair has been guessed.
- Once the clue board has not been seen for 5 consecutive clues, or a context/clue pair has been guessed 20 times, the most frequently guessed clue/context pair is sent to the score tracker topic.
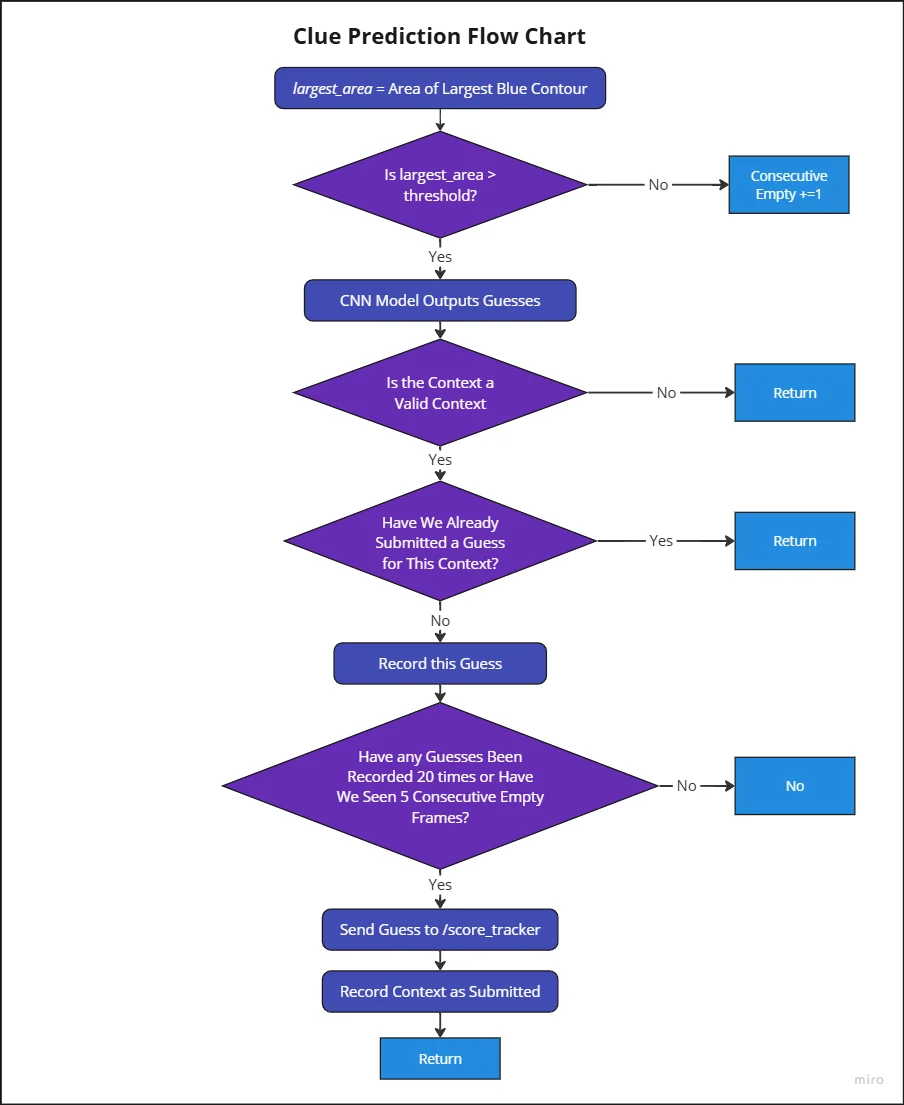
Clue Prediction Flow Chart
Clue GUI in Action
Driving - Imitation Learning
Data Acquisition
One of the biggest challenges with imitaiton learning is getting high quality examples for the model to learn from.
A basic driving controller is provided to us students, however, the quality of the controls is quite poor. You can only really input left, right, backwards, forwards, and diagonal, with no way to fine tune your movements. This make driving feel really awkward and unnatural to the user, which results in poor quality data.
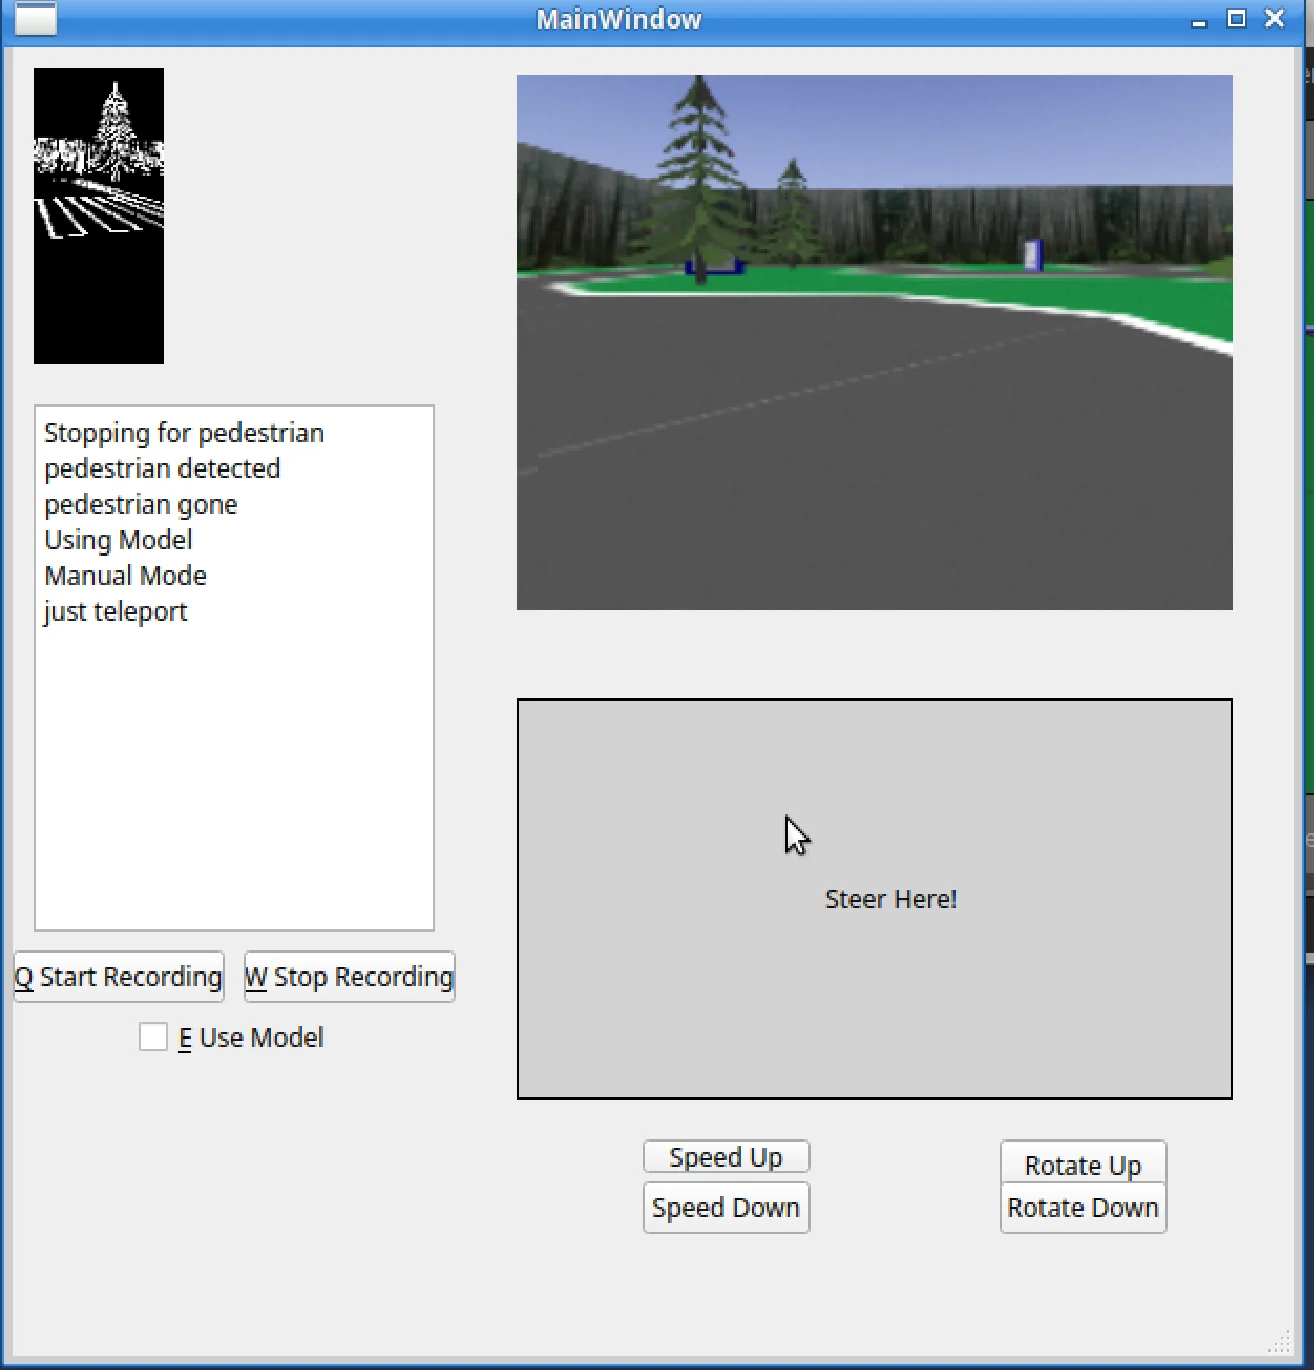
To solve this issue, I created another GUI to test imitation learning!
I created an area for the user to click and steer on using their mouse. I also added exponentials to the controller, allowing the user to do fine movements in the middle area, and large coarse movements at the edges of the controller area. This was inspired by my time tuning the RC controllers for our pilots on UBC Aerodesign :D
The GUI has a button that clears any previously built-up data, and then tells the GUI to begin logging data. The GUI records the current camera frame (at a low resolution) and the robots current linear and angular velocity, and then appends this data to a list. Any data points where the robot is perfectly still are discarded.
Once the user hits the stop recording button, a pop-up appears allowing the user to save the data as a gzipped pickle file (wacky I know, I'm sorry).
Imitation Learning GUI - Robot Controller
I found that when it came to data, we found quality beat quantity. There are actually only a few full runs in our final dataset!
Most of the footage is of me driving slowly past the sign boards in a manner so that they're visible to the camera. There's also lots of footage of me driving on trickier areas of the track.
I also trained the model to avoid collisions. I froze obstables like the truck or baby Yoda, plopped the car super close to them, and recorded myself backing up. I also collected data of myself waiting for the truck or baby Yoda to pass and following it from a safe distance.
Imitation Learning Model
Here's the rundown of our convolutional neural network for end-to-end driving:
- Takes 150x200 colour images
- Contains three convolution layers each followed by a ReLU activation function
- Pooling layer after the last convolution layer
- That layer is flattened and passed to a fully coonnected layer, which then splits into two seperate fully conncted layers, one for linear velocity and one for angular velocity
- The final layer for each branch is a single neuron which outputs a float representing a linear or angular velocity
For training:
- We used mean square error as our criterion for this regression task
- We used SGD as our optimizer again with a learning rate of 0.001
- I didn't bother with a validation set as collecting data was more time consuming/frustrating than just testing the model itself
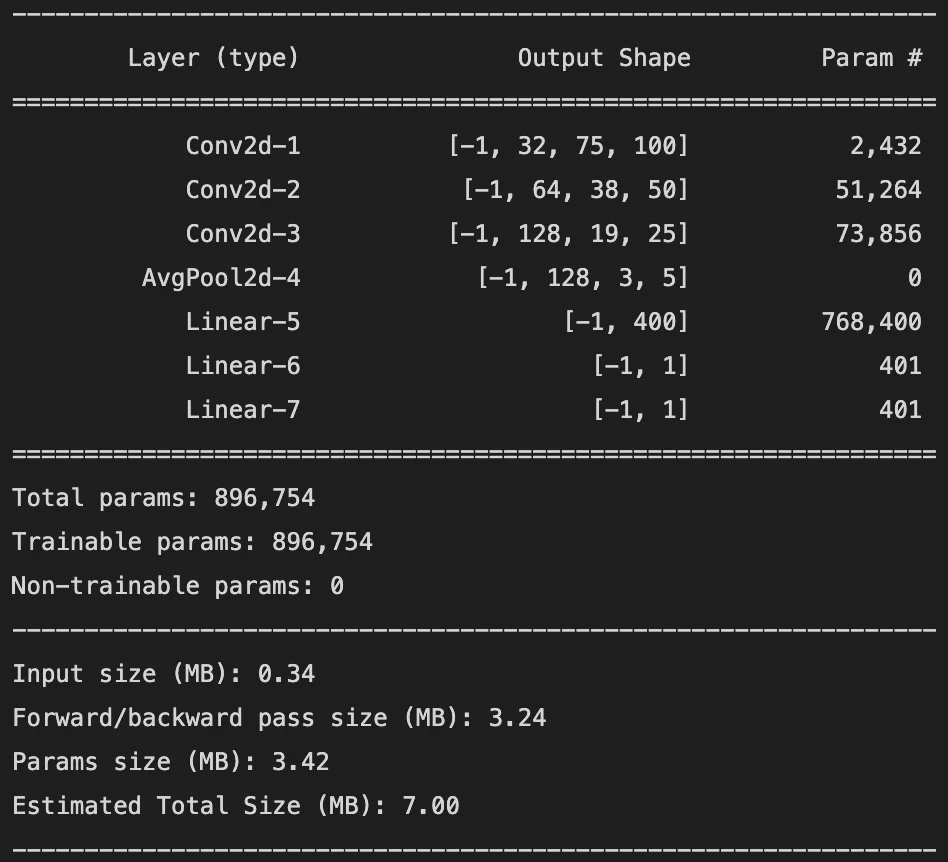
Imitation Learning Model Summary
Testing
TO BE WRITTEN LATER. See the final report linked in the "about" to hear the rest of the story if you can't wait!